


Gene loss pattern after teleost-specific whole genome duplication
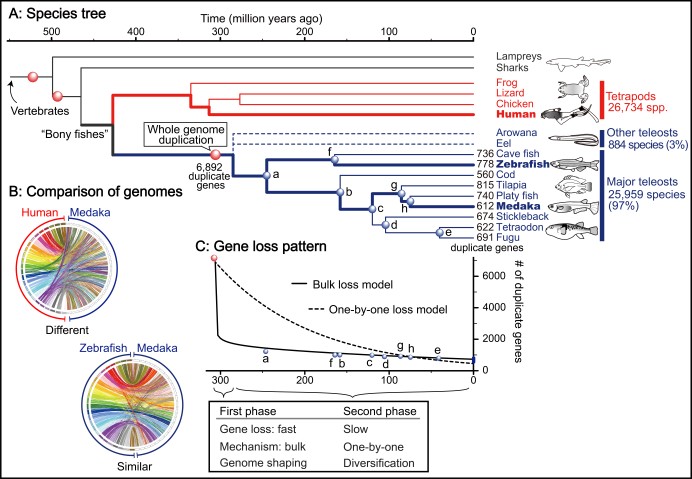
Figure 2. Gene loss pattern after teleost-specific whole genome duplication.
A: Species tree showing major vertebrate groups and their evolutionary relationships.
B: The comparison of genomes between two species with the coloured lines showing corresponding genes between human and medaka (upper circle) and between zebrafish and medaka (lower circle). The structure is quite different between human and medaka, while it is similar between zebrafish and medaka.
C: Gene loss pattern showing the two-phase loss of duplicate genes in teleost fishes. A and C use the same timeline.
Copyright OIST (Okinawa Institute of Science and Technology Graduate University, 沖縄科学技術大学院大学). Creative Commons Attribution 4.0 International License (CC BY 4.0).
Tags


