


Graph Showing Effect of Polarization on Electrical Current

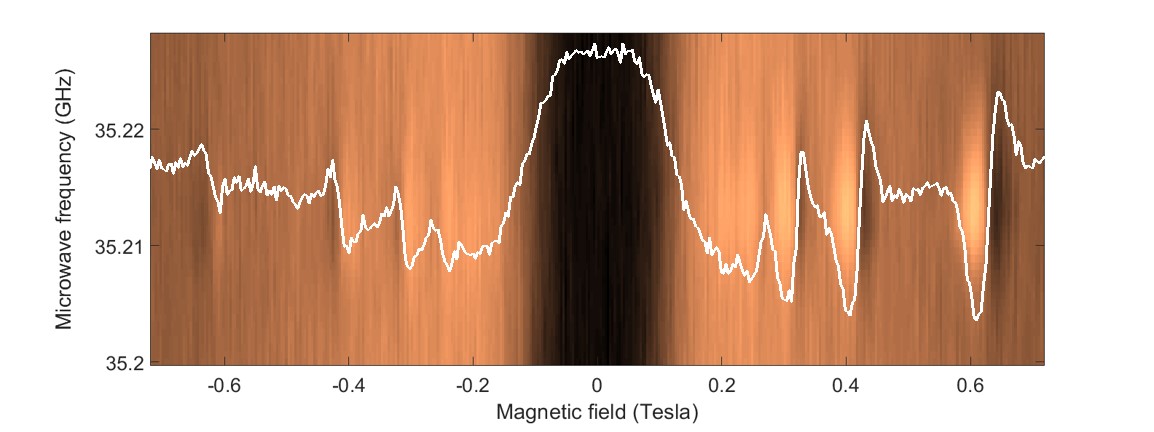
The color plot represents the current of electrons as the magnetic field and frequency of microwaves is varied. The white line highlights the strong dependence of the current on the direction of the magnetic field.
The color plot represents the current of electrons as the magnetic field and frequency of microwaves is varied. The white line highlights the strong dependence of the current on the direction of the magnetic field.
Date:
26 March 2018
Copyright OIST (Okinawa Institute of Science and Technology Graduate University, 沖縄科学技術大学院大学). Creative Commons Attribution 4.0 International License (CC BY 4.0).
Tags
Research
Share on:


