Dendrite Diagram

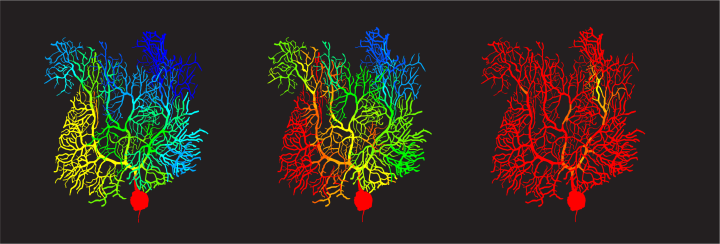
A diagram produced by the model showing the response of a Purkinje cell to climbing fiber input while increasing baseline voltage (left to right). Red shows an increased signaling response or “spike” in the dendrites.
A diagram produced by the model showing the response of a Purkinje cell to climbing fiber input while increasing baseline voltage (left to right). Red shows an increased signaling response or “spike” in the dendrites.
Date:
07 August 2018
Copyright OIST (Okinawa Institute of Science and Technology Graduate University, 沖縄科学技術大学院大学). Creative Commons Attribution 4.0 International License (CC BY 4.0).
Tags
Research


