


mgu FY2012 Annual Report 3.2 fig2

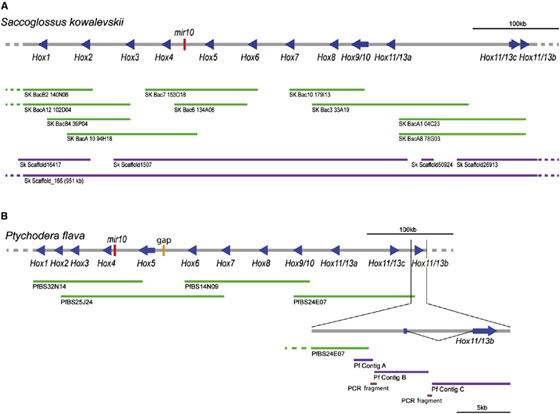
Figure 2. Clustering of Hox Genes in Hemichordate Genomes Genomic regions ∼500 kb-long are shown for (A) Saccoglussus kowalevskii and (B) Ptychodera flava. Both contain the 12 genes Hox1 to Hox11/13b (blue arrows in the direction of transcription). In both, the ten genes Hox1–Hox11/13a are aligned in the same direction, whereas two genes, Hox11/13c and Hox11/13b, are in the opposite direction. Red bars indicate the position of mir10 genes, and the orange bar in (B) indicates a gap. BAC clones are shown as green lines, scaffolds or contigs obtained from whole-genome shotgun reads as purple lines, and PCR-amplified fragments as brown lines.
Copyright OIST (Okinawa Institute of Science and Technology Graduate University, 沖縄科学技術大学院大学). Creative Commons Attribution 4.0 International License (CC BY 4.0).


