


mbu FY2014 Annual Report Figure 4

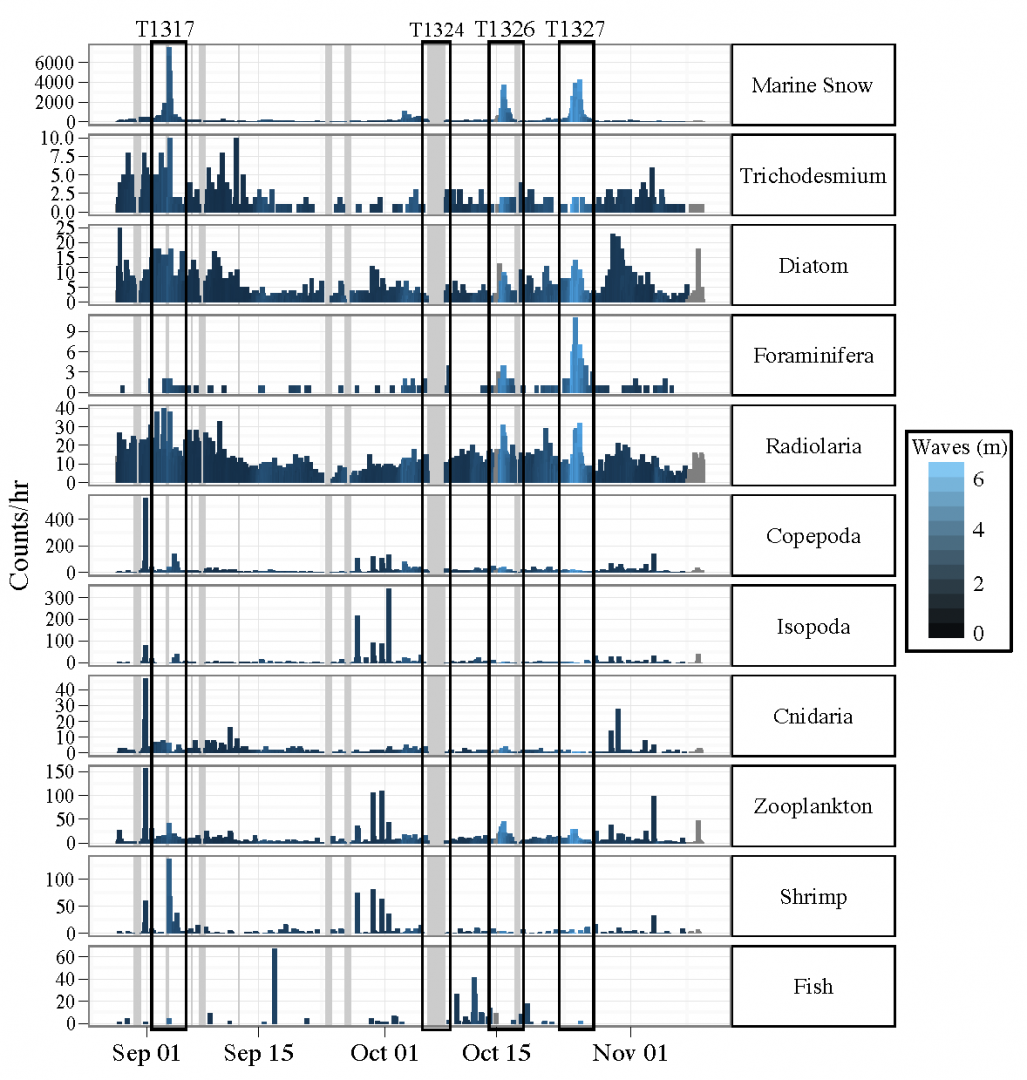
Fig. 4. Temporal variation in abundance (counts/h) of particle and plankton types during the sampling period. Colour scale represnts significant wave height (m), gray shading indicates missing wave height information. White boxes correspond to typhoons.
Date:
06 March 2024
Copyright OIST (Okinawa Institute of Science and Technology Graduate University, 沖縄科学技術大学院大学). Creative Commons Attribution 4.0 International License (CC BY 4.0).
Share on:


