


obu FY2013 Annual Report 7

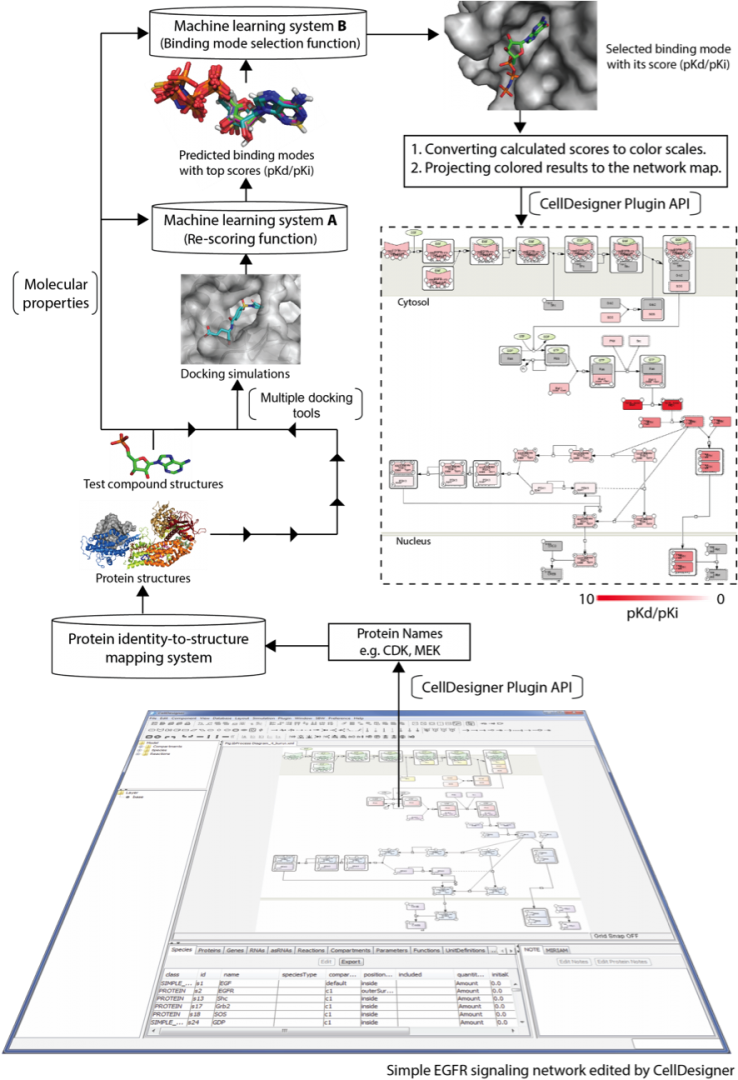
Figure 6: Schematic of the signaling network-based screening pipeline. First, a signaling network is launched by CellDesigner. The identities of proteins involved in the network are retrieved by the CellDesigner plugin API to look up corresponding protein structures in 3D through a protein identity-to-structure mapping system. Second, users submit test compounds for docking simulation. After docking simulation using three docking tools, machine learning system A is then applied to re-score generated binding modes based on features of binding interactions and the test compound's molecular properties, after which, it ranks them. Machine learning system B is subsequently to select a binding mode with the greatest reliability from the three top-score modes. Screening is iterated to assess the next protein until all pathway proteins have been tested. Finally, docking scores are converted into a white-to-red color scale to interpret binding strength, and are projected on the network map for a comprehensive inspection.
Copyright OIST (Okinawa Institute of Science and Technology Graduate University, 沖縄科学技術大学院大学). Creative Commons Attribution 4.0 International License (CC BY 4.0).


