


nnp FY2017 Annual Report 3.1 Figure 1

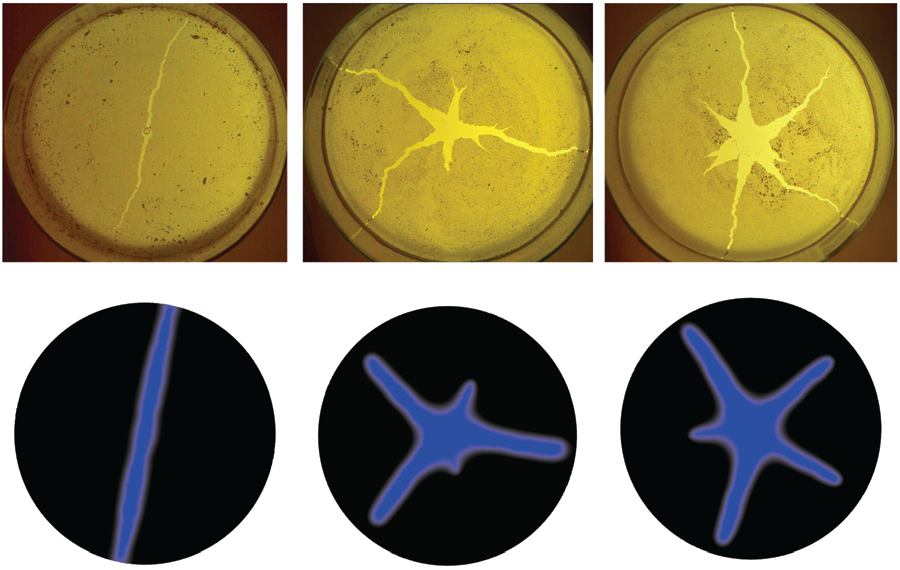
Figure 1: Experimental (top) and simulation (bottom) images of surfactant driven particulate fracture patterns.
Date:
05 March 2024
Copyright OIST (Okinawa Institute of Science and Technology Graduate University, 沖縄科学技術大学院大学). Creative Commons Attribution 4.0 International License (CC BY 4.0).
Share on:


