


nnp FY2013 Annual Report 3.1 Figure 1

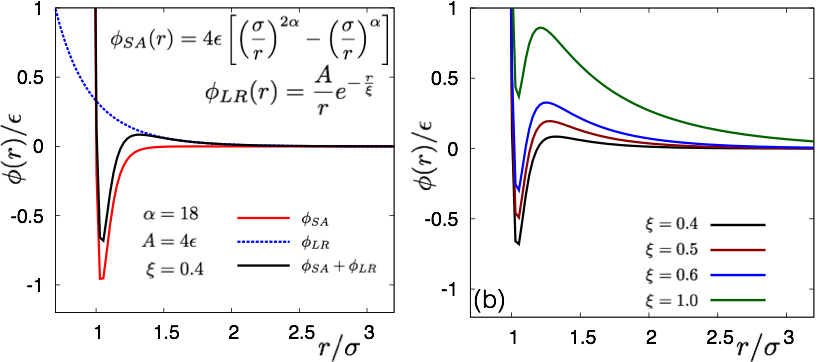
Fig.1 Functional form of the effective pair-potential has been plotted together with its short-attraction and long-repulsion part for specific parameter values indicated in (a). Note that the global minimum of the effective potential is followed by a positive energy barrier at finite distance from particle core. Increase in the energy barrier as a function increasing repulsion length is shown in (b).
Date:
05 March 2024
Copyright OIST (Okinawa Institute of Science and Technology Graduate University, 沖縄科学技術大学院大学). Creative Commons Attribution 4.0 International License (CC BY 4.0).
Share on:


