


ncu Annual Reports FY2015 10

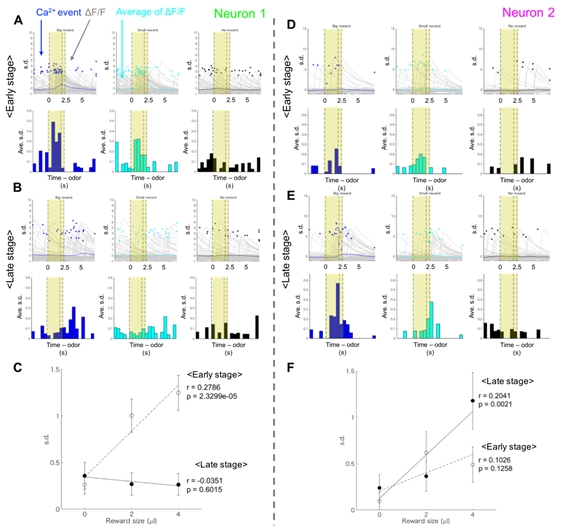
Figure 3.2.3: (A, B) An example of striatal neural activity modulated by the upcoming reward amount in the early learning stage (Type I value-coding neuron). Yellow areas indicate the CS and delay period. (C) Averaged activities of Neuron 1 in the CS-delay period. The significant correlation was observed between the reward size and the neural activity in the early learning stage. (D, E) An example of striosomal neural activity modulated by the upcoming reward amount in the late learning stage (Type II value-coding neuron). (F) Averaged activities of Neuron 2 in the CS-delay period. The significant correlation was observed between the reward size and the neural activity in the late learning stage.
Copyright OIST (Okinawa Institute of Science and Technology Graduate University, 沖縄科学技術大学院大学). Creative Commons Attribution 4.0 International License (CC BY 4.0).


