ncu Annual Report 2014 11
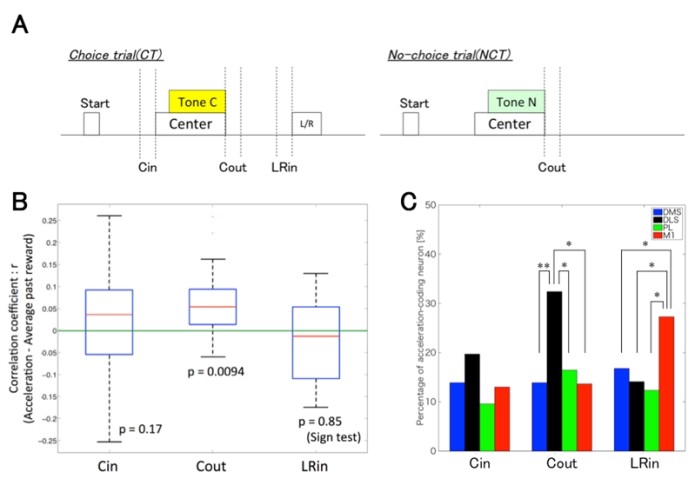
Figure 3.2.3: A, Schematic representation of trial phases. Cin: 200 ms until the center hole poke, Cout: 200 ms from moving out of the center hole, LRin: 200 ms until the left or right hole poke. B, Boxplot of correlation coefficient between each phase’s acceleration in CC and the average past reward. The acceleration in Cout phase was only correlated with the average past reward. The p-values were calculated by the sign test. C, The proportion of the acceleration-coding neurons in 3 phases in CC. The proportion of DLS neurons coding the acceleration in Cout was significantly larger than in the other areas. χ2 test, *: p < 0.05, **: p<0.01.
Copyright OIST (Okinawa Institute of Science and Technology Graduate University, 沖縄科学技術大学院大学). Creative Commons Attribution 4.0 International License (CC BY 4.0).


