ncu Annual Report 2014 9

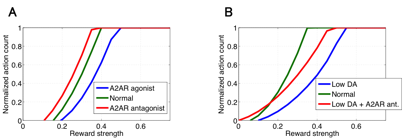
Figure 3.1.6: Simulated behavioral modulation in several pharmacological settings by the using circuit level model of cortico-basal ganglia pathways. In each panel, horizontal and vertical axes represent applied reward strength and behavioral frequency, respectively. (A) Action modulation induced by A2AR agonist (blue line) and antagonist (red line). (B) Simulated Parkinsonian state (blue line) and the relieved state by A2AR antagonist (red line).
Date:
05 March 2024
Copyright OIST (Okinawa Institute of Science and Technology Graduate University, 沖縄科学技術大学院大学). Creative Commons Attribution 4.0 International License (CC BY 4.0).


