


ncu Annual Report 2014 8

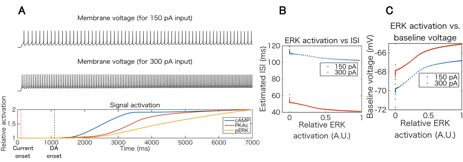
Figure 3.1.5: Integrated simulation of intracellular signal transduction and electrophysiology of D1R-MSN. (A) Top and middle plots show simulated voltage traces for different current injections (150 pA and 300 pA, respectively), and bottom plot is time course of relative activation of key signaling molecules including cAMP, PKA, and ERK. (B) and (C) Inter spike interval and baseline voltage changes versus active ERK level.
Date:
05 March 2024
Copyright OIST (Okinawa Institute of Science and Technology Graduate University, 沖縄科学技術大学院大学). Creative Commons Attribution 4.0 International License (CC BY 4.0).
Share on:


