


ncu Annual Report 2014 6

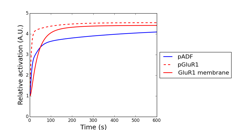
Figure 3.1.3: Simulated phosphorylation profiles of synaptic plasticity related proteins by using AMPAR trafficking model. Red, red dashed, and blue lines represent relative concentration of membrane trafficked GluR1, intracellular GluR1, and phosphorylated cofilin, respectively.
Date:
05 March 2024
Copyright OIST (Okinawa Institute of Science and Technology Graduate University, 沖縄科学技術大学院大学). Creative Commons Attribution 4.0 International License (CC BY 4.0).
Share on:


