


csu FY2019 Annual Report 3.3 Figure 5

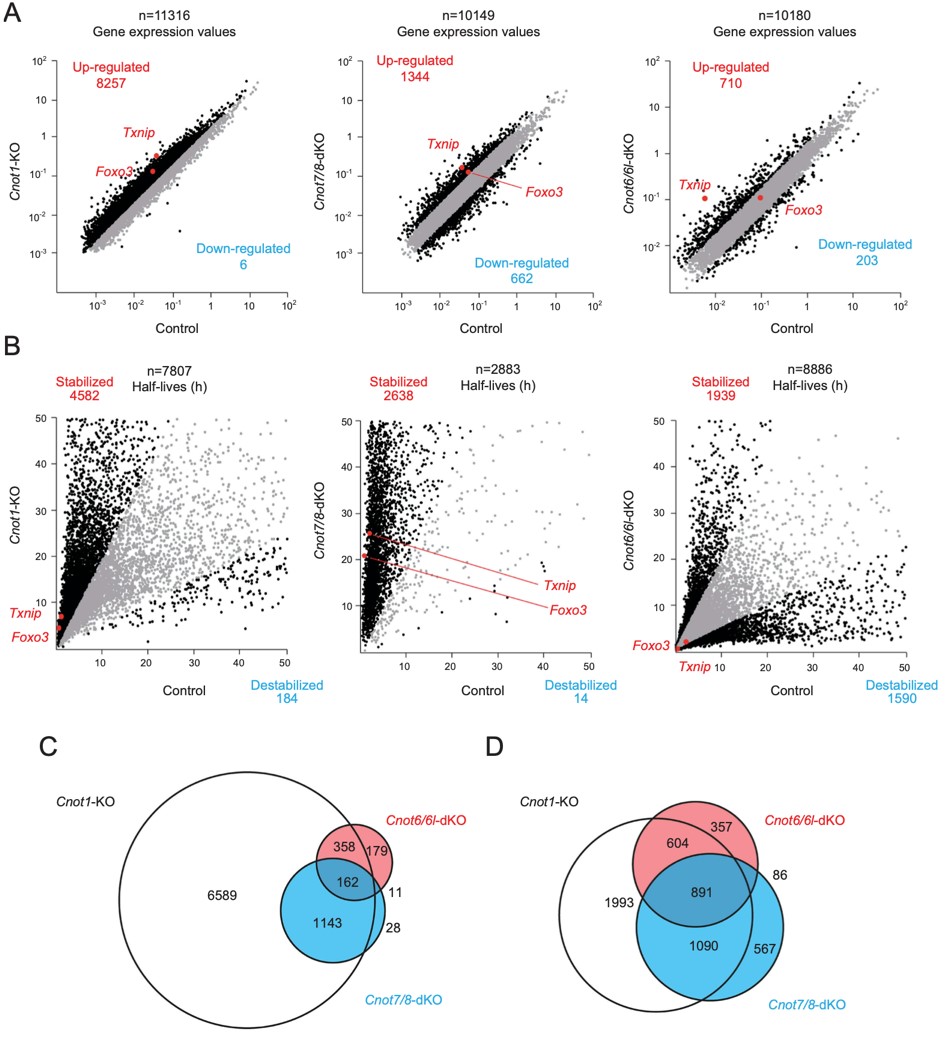
Figure 5. Gene expression and mRNA stability differ among Cnot1-KO, Cnot7/8-dKO and Cnot6/6l-dKO MEFs. RNA-seq analysis of Cnot1-KO, Cnot7/8-dKO and Cnot6/ 6l-dKO MEFs compared to controls: Cnot1-flox MEFs infected with mock retrovirus, Cnot8-flox MEFs infected with mock retrovirus and WT MEFs, respectively (n = 2). (A, B) Scatter plots comparing gene expression values (A) or mRNA half-lives (B). mRNAs showing expression (A) or half-lives (B) that differed more than twofold are displayed in black. All values represent the means of two independent experiments. (C, D) Venn diagrams showing overlap of upregulated (C) or stabilized genes (D) (more than twofold) in Cnot1-KO, Cnot7/8-dKO and Cnot6/6l-dKO MEFs compared to controls.
Copyright OIST (Okinawa Institute of Science and Technology Graduate University, 沖縄科学技術大学院大学). Creative Commons Attribution 4.0 International License (CC BY 4.0).


