


csu FY2019 Annual Report 3.1 Figure 3

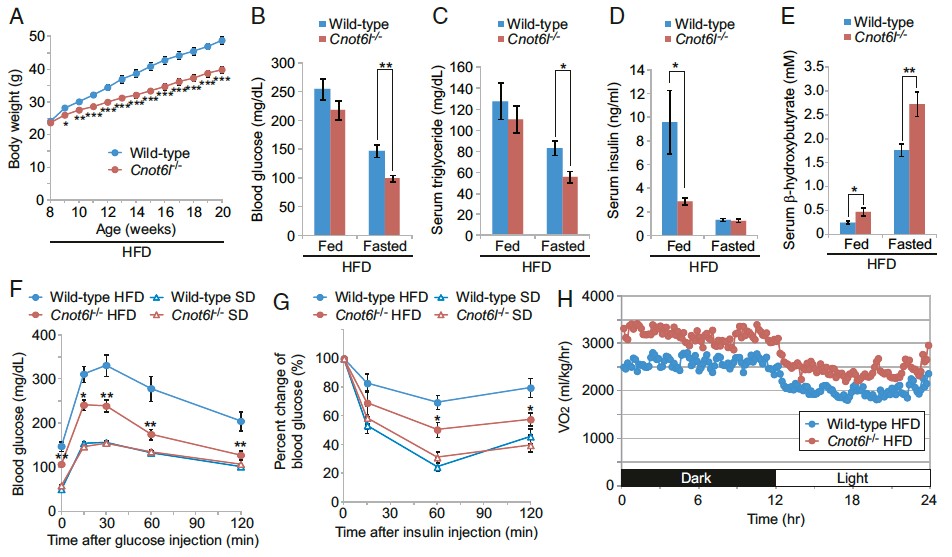
Figure 3. Protection from diet-induced metabolic disorders and enhanced energy expenditure in CNOT6L-/- mice. (A) Growth curves on high-fat diet. Levels of (B) blood glucose, (C) serum triglyserol, (D) serum insulin, (E) serum b-hydrooxybutyrates in mice on high fat diet or fasting. Intraperitoneal glucose torelance tests (F) and insulin torerance tests (G) of mice on high-fat or standard tests. (H) oxygen consumption.
Date:
04 March 2024
Copyright OIST (Okinawa Institute of Science and Technology Graduate University, 沖縄科学技術大学院大学). Creative Commons Attribution 4.0 International License (CC BY 4.0).
Share on:


