


ncu FY2013 Annual Report 12

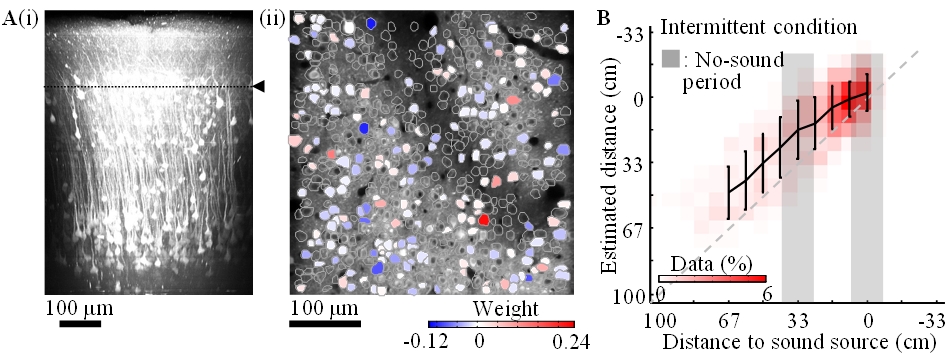
Figure 3.2.4: A-i. In-vivo imaging of neurons with two-photon microscopy. XZ plane reconstruction of calcium sensor expressing cortical neurons in posterior parietal cortex. The dotted line indicates the imaging plane in A-ii. A-ii. Neurons coding sound-source distance. 282 (somata colored red or blue) among 540 neurons were extracted by LASSO. The colors show the weights in LASSO. B. Distance estimation extracted from neuronal activity with LASSO. Horizontal and vertical axes show the actual and estimated distance to sound source, respectively. The estimations were successful even during the no-sound periods in the intermittent condition.
Copyright OIST (Okinawa Institute of Science and Technology Graduate University, 沖縄科学技術大学院大学). Creative Commons Attribution 4.0 International License (CC BY 4.0).


