ncu FY2013 Annual Report 8
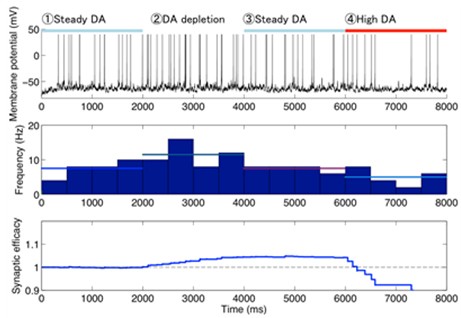
Figure 3.1.8: A typical example of simulated electrophysiological response of (D2R-expressing) MSN to varied dopamine input. Top to bottom figures represent transient membrane potential, firing rate, and corticostriatal synaptic weight of the neuron, respectively. Horizontal bars on the top figure represent the duration of different levels of dopamine input (steady: 10 nM, deprivation: 0 nM, high: 1μM).
Date:
04 March 2024
Copyright OIST (Okinawa Institute of Science and Technology Graduate University, 沖縄科学技術大学院大学). Creative Commons Attribution 4.0 International License (CC BY 4.0).


