ncu FY2013 Annual Report 7

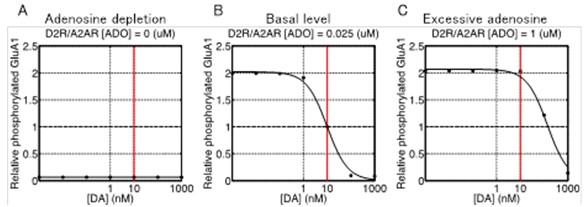
Figure 3.1.7: Dopamine dose-dependent responses of phosphorylation of AMPAR after 500 sec after stimulus onset at three different extracellular adenosine levels (A to C). Horizontal and vertical axes represent input level of dopamine (logarithmic scale) and relative level of phosphorylation scaled to the value at 10 nM when a basal level of adenosine (25 nM), respectively. Dots in each plot are the values obtained by simulation and the solid line is generated by nonlinear regression of the data.
Date:
04 March 2024
Copyright OIST (Okinawa Institute of Science and Technology Graduate University, 沖縄科学技術大学院大学). Creative Commons Attribution 4.0 International License (CC BY 4.0).


