


ncu FY2013 Annual Report 4

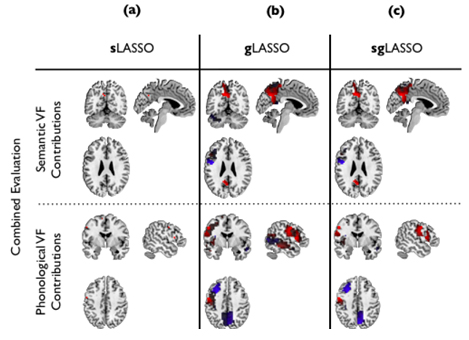
Figure 3.1.4: Brain areas contributing to the classification of combined semantic and phonological fMRI data. Red and blue indicate locations in the brain contributing to the identification of depressed subjects and healthy subjects, respectively. The columns correspond to three different classifiers: (a) sLASSO; (b) gLASSO; (c) and sgLASSO, respectively.
Date:
04 March 2024
Copyright OIST (Okinawa Institute of Science and Technology Graduate University, 沖縄科学技術大学院大学). Creative Commons Attribution 4.0 International License (CC BY 4.0).
Share on:


