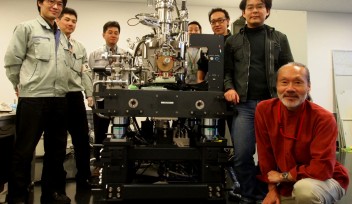
ndu FY2012 Annual Report Figure 3
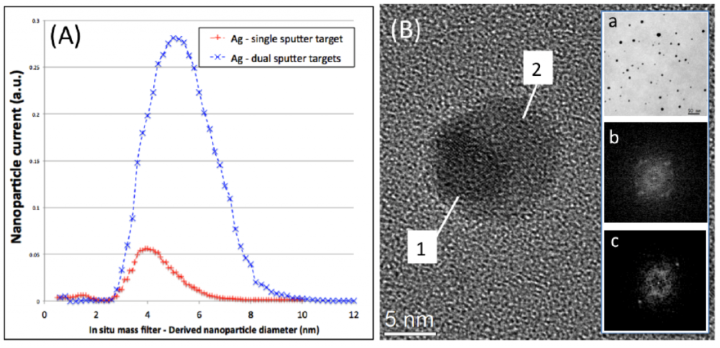
Fig. 3: (A) Quadrupole mass spectra for different sputtering configurations (B) TEM micrographs of Ag-Ag nanoparticles. Region 1 is nanocrystalline, region 2 is single crystalline. Insets (a) - low magnification overview, showing distribution in nanoparticle sizes (b) FFT of Region 1 (c) FFT of Region 2. (C. Cassidy et al., MRS Spring 2013).
Date:
01 March 2024
Copyright OIST (Okinawa Institute of Science and Technology Graduate University, 沖縄科学技術大学院大学). Creative Commons Attribution 4.0 International License (CC BY 4.0).


