g0 FY2020 Annual Report Figure 2

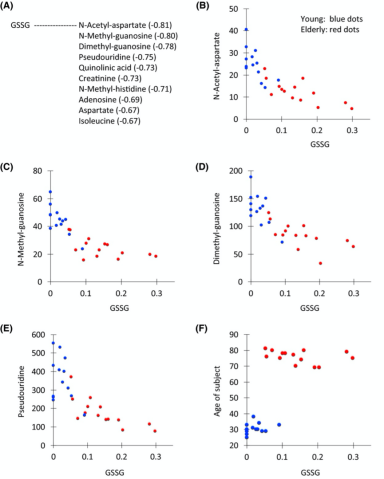
Figure 2. Scatter plots between GSSG and correlated compounds or age. (A) Ten metabolites with the relatively high correlations with GSSG are listed. Scatter plot of the peak abundance between GSSG and N-acetyl aspartate (B), N-methyl guanosine (C), dimethyl-guanosine (D), pseudouridine (E), and the age of the subject (F). Dots for young and elderly subjects are blue and red, respectively.
Date:
28 February 2024
Copyright OIST (Okinawa Institute of Science and Technology Graduate University, 沖縄科学技術大学院大学). Creative Commons Attribution 4.0 International License (CC BY 4.0).


