g0 FY2014 Annual Report Figure 1
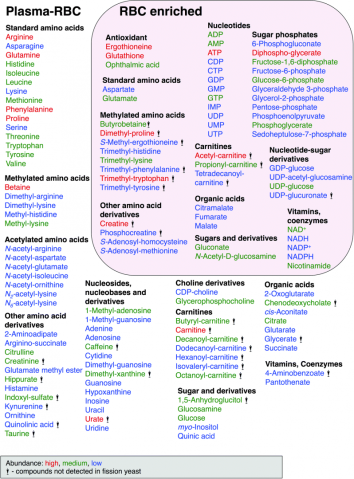
Figure 1: Human blood compounds identified and characterized in this study. Abundance of compounds classified by peak area size, indicated by color, red (high), green (medium) and blue (low). Compounds with the statue symbol are not present in S. pombe.
Date:
28 February 2024
Copyright OIST (Okinawa Institute of Science and Technology Graduate University, 沖縄科学技術大学院大学). Creative Commons Attribution 4.0 International License (CC BY 4.0).


