


nnp FY2015 Annual Report 3.2 Figure 1

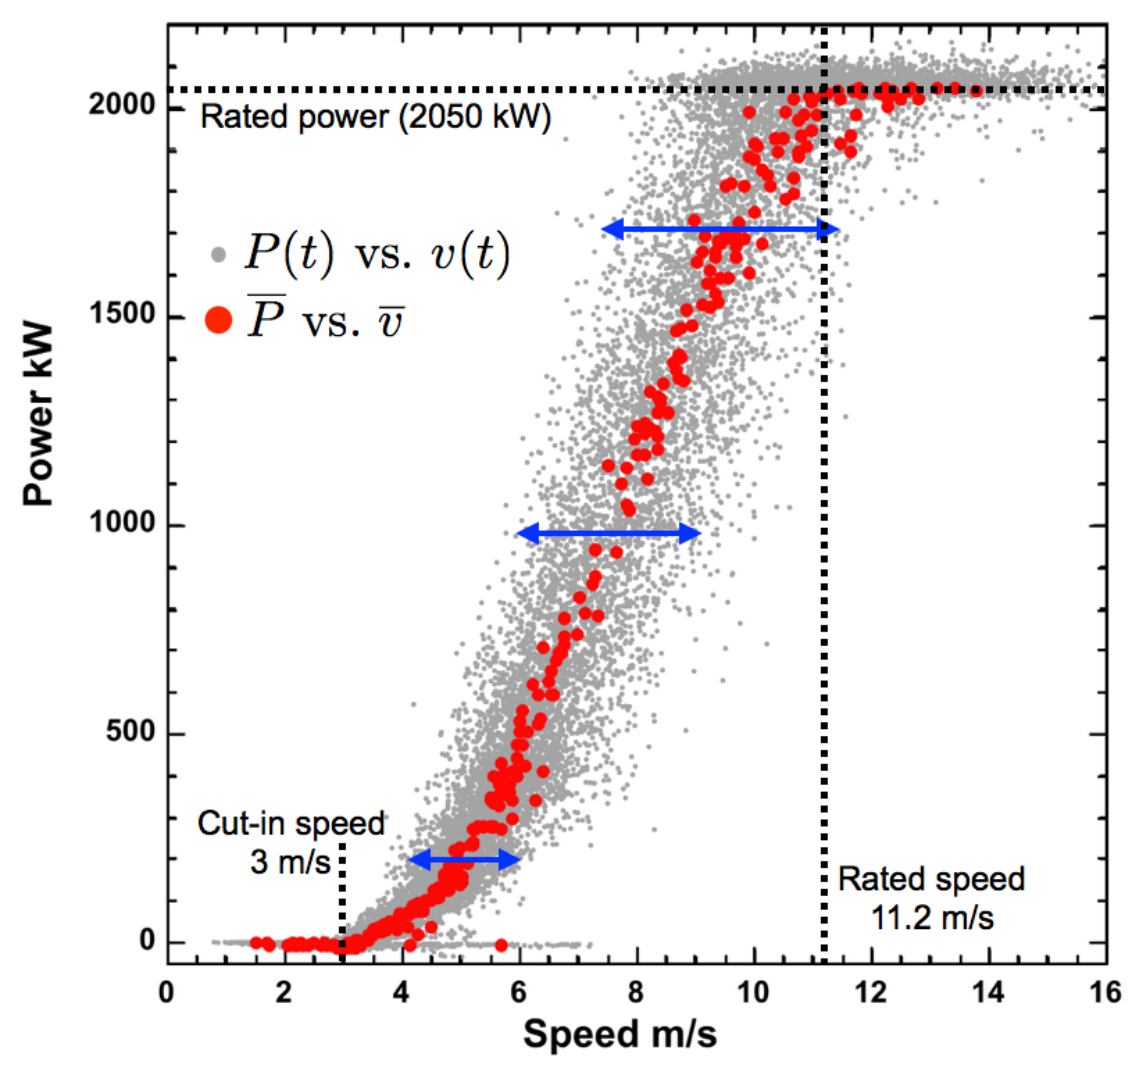
Figure 1: Instantaneous power P(t) versus instantaneous wind speed v(t) in solid grey circles and time-averaged power versus time-averaged wind speed in solid red circles for 2.05 MW MM92 turbine in Howard, NY. Considerable scatter in P(t) versus v(t) occurs about the time-averaged power curve. The scatter increases with mean speed as qualitatively shown with blue arrows at v = 5, 7 and 9 m/s.
Date:
05 March 2024
Copyright OIST (Okinawa Institute of Science and Technology Graduate University, 沖縄科学技術大学院大学). Creative Commons Attribution 4.0 International License (CC BY 4.0).
Share on:


