


nnp FY2013 Annual Report 3.1 Figure 3

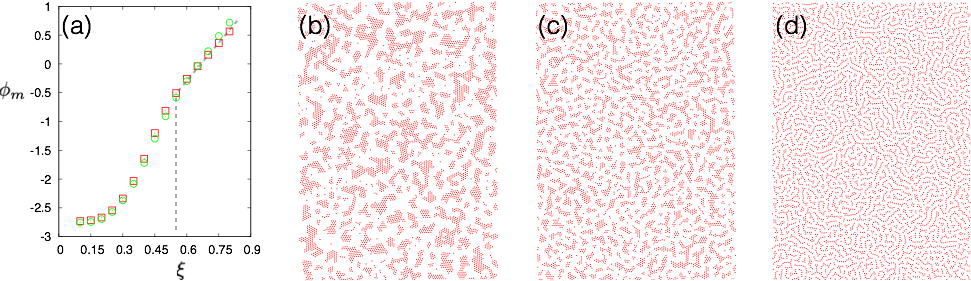
Fig.3 The potential energy perparticle of the inherent structure (described in text) is plotted as a function of repulsion length (a). Please note the functional change when the repulsion length equals attraction well width. Choosing this repulsion length as a reference, we plot the particle configurations of obtained inherent structures (b) below, (c) at and (d) above the refernce value at fixed density and temperature. A compact to non-compact structural transition of aggregates is evident from visual inspection itself.
Date:
05 March 2024
Copyright OIST (Okinawa Institute of Science and Technology Graduate University, 沖縄科学技術大学院大学). Creative Commons Attribution 4.0 International License (CC BY 4.0).
Share on:


