


ndu FY2014 Annual Report Figure 3.4

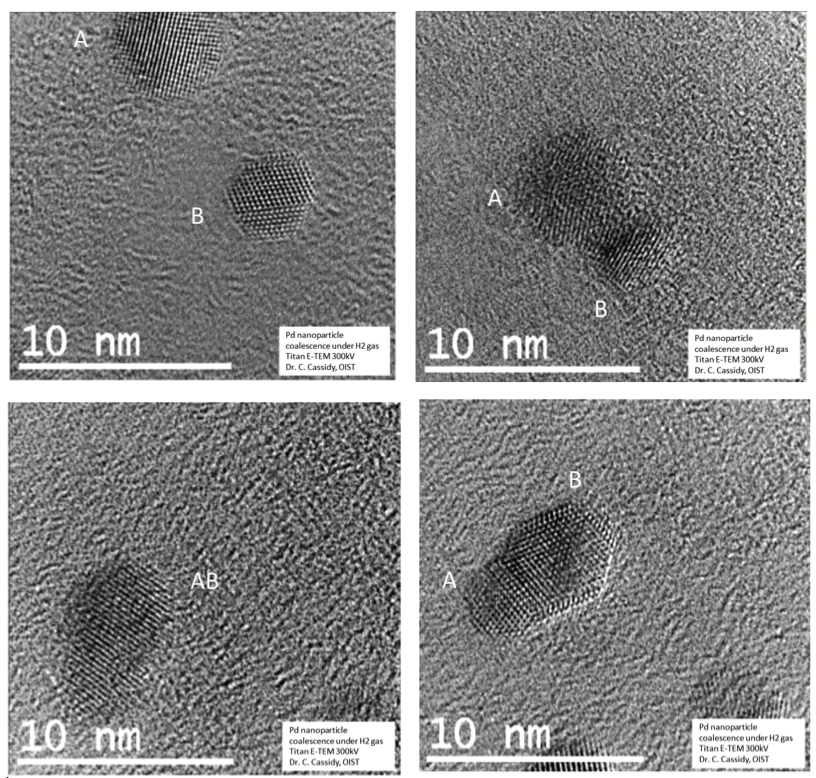
Figure. 3.4. Palladium nanoparticles in hydrogen gas as visualized in the Transmission Electron Microscope (TEM). The panels show two nanoparticles merging together to form one. In the first panel (upper-left), you can clearly see dots in nanoparticle B. These are columns of individual atoms, demonstrating the extreme sensitivity and high resolution of this microscope.
Date:
01 March 2024
Copyright OIST (Okinawa Institute of Science and Technology Graduate University, 沖縄科学技術大学院大学). Creative Commons Attribution 4.0 International License (CC BY 4.0).
Share on:


