


ncu FY2012 Annual Report 7

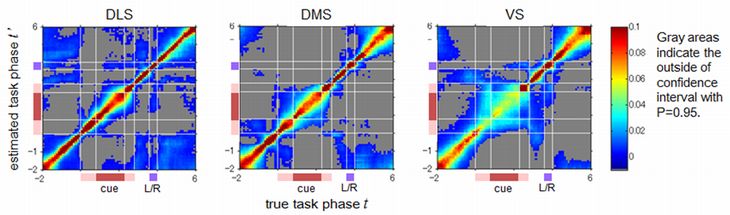
Figure 6: Predictions of trial phases from 100 neurons in DLS, DMS, and VS. The estimated posterior probabilities of trial phases for a correct trial phases are represented by pseudo color.
Date:
04 March 2024
Copyright OIST (Okinawa Institute of Science and Technology Graduate University, 沖縄科学技術大学院大学). Creative Commons Attribution 4.0 International License (CC BY 4.0).
Share on:


