


ncu FY2012 Annual Report 13

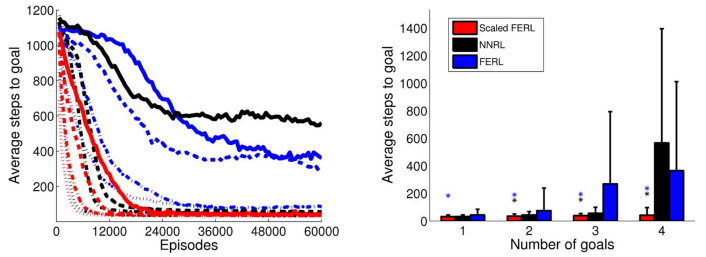
Figure 12: The average number of time steps to goal for the whole learning process (left panel) and in the final 100 episodes (right panel), for the four experiments with 1, 2, 3, and 4 goal areas. The average values were computed over every 100 episodes and 10 simulation runs in each experiment. In the left panel, the line type indicates the number of goals: dotted lines for 1 goal, dash-dotted lines for 2 goals, dashed lines for 3 goals, and solid lines for 4 goals. The colored asterisks in the right panel indicate experiments in which the final average performance of scaled FERL was significantly better (p < 0 . 001) than NNRL (black) or FERL (blue).
Copyright OIST (Okinawa Institute of Science and Technology Graduate University, 沖縄科学技術大学院大学). Creative Commons Attribution 4.0 International License (CC BY 4.0).


