


mbnu_F12

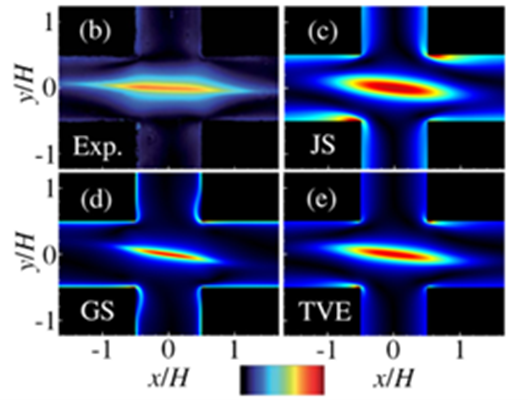
Figure 12: Contours of the (b) experimentally measured dimensionless principal stress difference versus the predictions of the (c) Johnson-Segalman, (d) Giesekus, and (e) thixotropic viscoelastic models.
Date:
25 March 2024
Copyright OIST (Okinawa Institute of Science and Technology Graduate University, 沖縄科学技術大学院大学). Creative Commons Attribution 4.0 International License (CC BY 4.0).
Share on:


