


ecsu Growth in cell size - chart

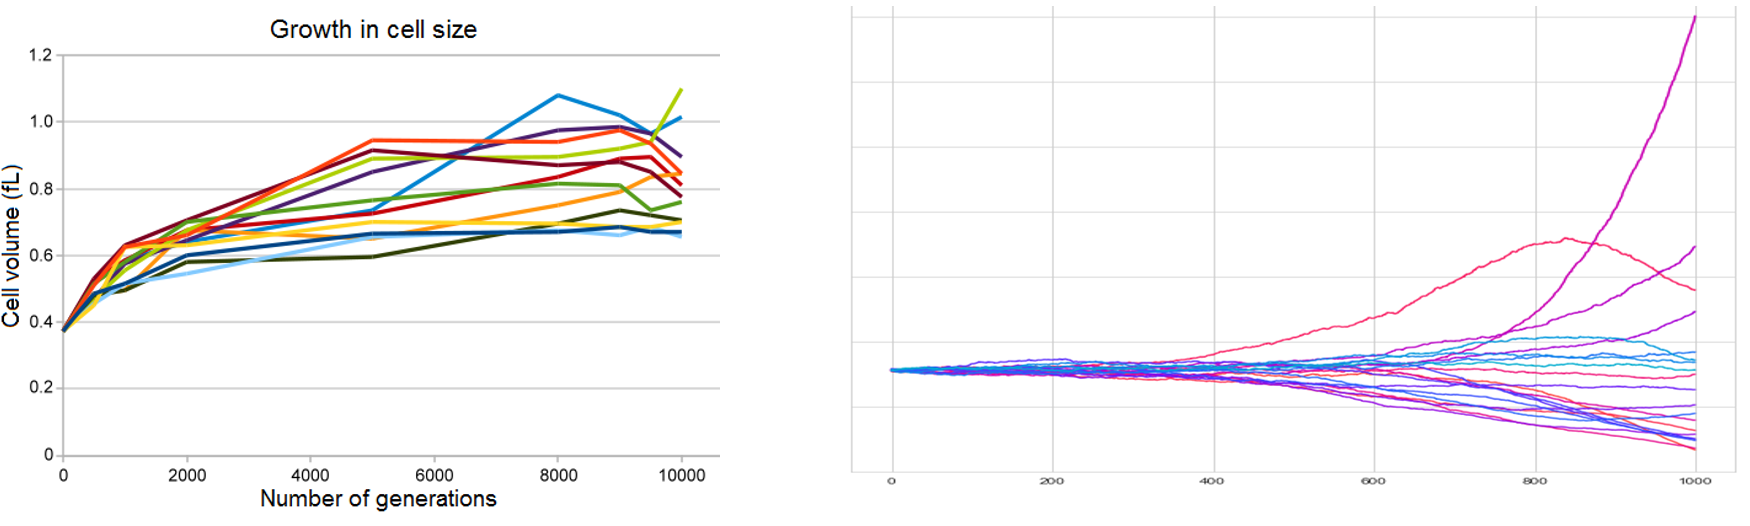
Figure 3. Cell size of E. coli cells in the long-term evolution experiment (data courtesy to Barrick et al., 2009) and growth trajectories from the "Yeast Model" simulation study.
Date:
17 January 2024
Copyright OIST (Okinawa Institute of Science and Technology Graduate University, 沖縄科学技術大学院大学). Creative Commons Attribution 4.0 International License (CC BY 4.0).
Share on:


