


bsmu FY2021 Annual Report 04

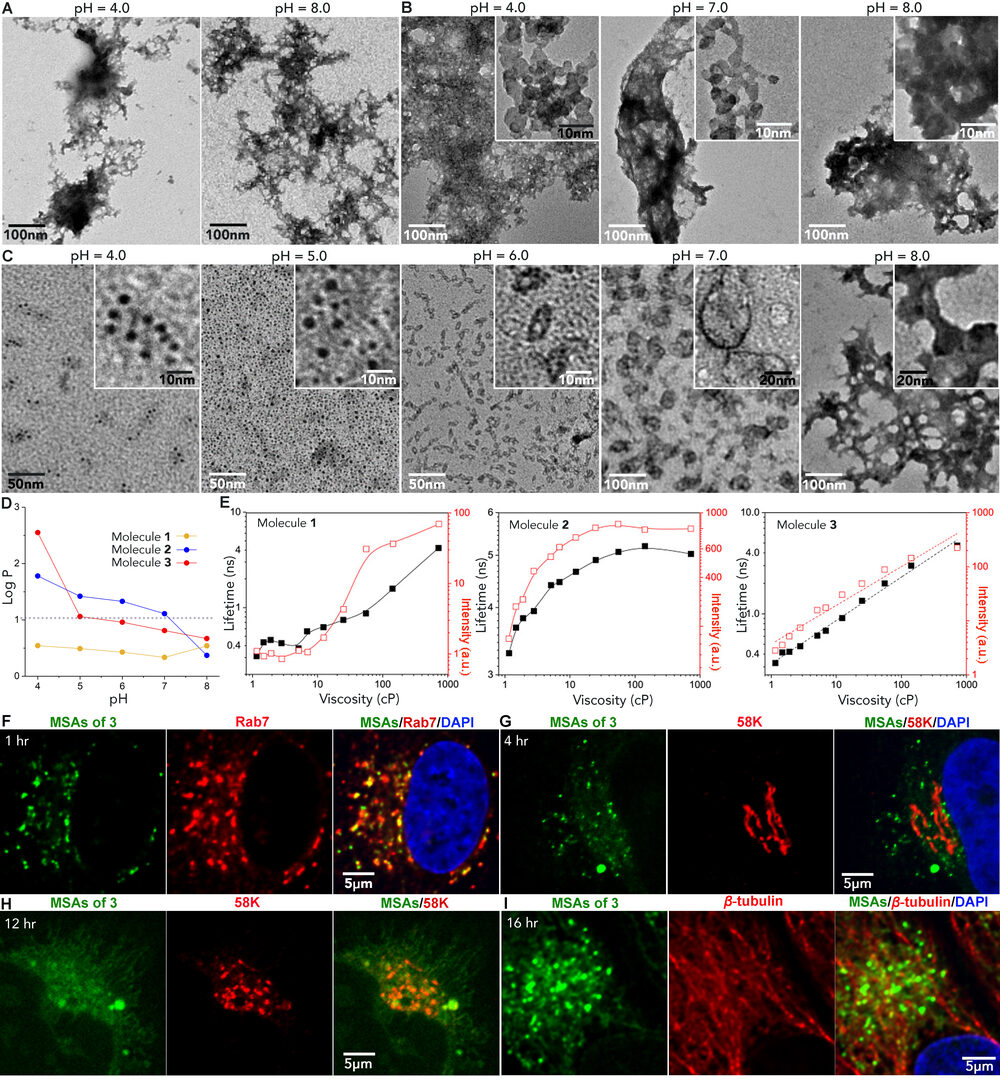
Figure 1. Environmentally responsive MSA targets microtubules. TEM images of 50 μM molecules 1 (A), 2 (B), and 3 (C) in pH buffer (Table S3). The insets are zoom-in views of the TEM images. (D) Lipophilicity (log Poct/wat) of molecules at various pH levels. (E) Plots of the fluorescence intensity (red) and fluorescence lifetime (black) of molecules against the viscosity of the medium (water/glycerol). Fluorescent images of the intracellular distribution of MSAs in HeLa cells upon incubation with molecule 3 (50 μM) for 1 h costained with anti-Rab7 antibody and DAPI (F), for 4 h costained with anti-58K antibody and DAPI (G), for 12 h costained with anti-58K antibody (H), and for 16 h costained with anti-β-tubulin antibody and DAPI (I).
Copyright OIST (Okinawa Institute of Science and Technology Graduate University, 沖縄科学技術大学院大学). Creative Commons Attribution 4.0 International License (CC BY 4.0).


