


bsmu FY2018 Annual Report 03

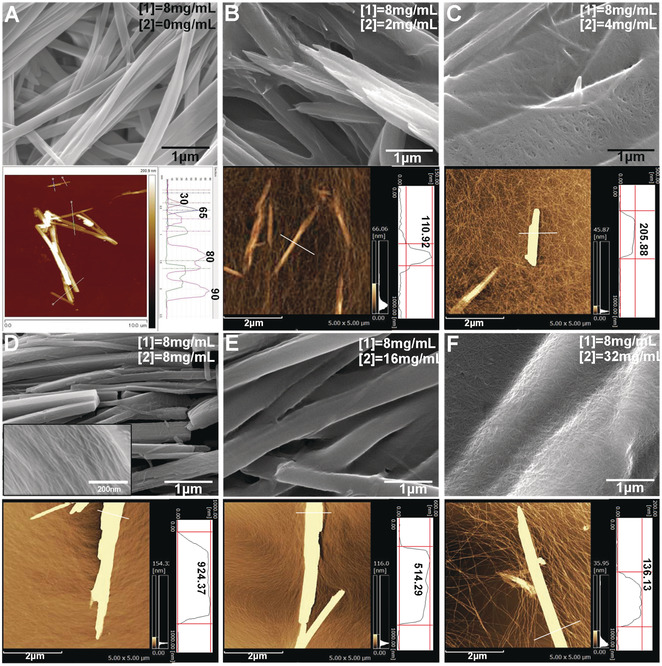
Figure 2: SEM images and the correlated AFM images with height profiles of A) SCSA of 1and B)–F) a mixture of 1 (8 mg mL−1) with 2 at various concentrations, from B) 2 mg mL−1, C) 4 mg mL−1, D) 8 mg mL−1, E) 16 mg mL−1, to F) 32 mg mL−1 in H2O/DMSO (v/v=9:1). The inset SEM image in (D) is the section structure of layer‐by‐layer nanosheet.
Date:
01 March 2024
Copyright OIST (Okinawa Institute of Science and Technology Graduate University, 沖縄科学技術大学院大学). Creative Commons Attribution 4.0 International License (CC BY 4.0).
Share on:


